Sign up to take part
Registered users can ask their own questions, contribute to discussions, and be part of the Community!
Registered users can ask their own questions, contribute to discussions, and be part of the Community!
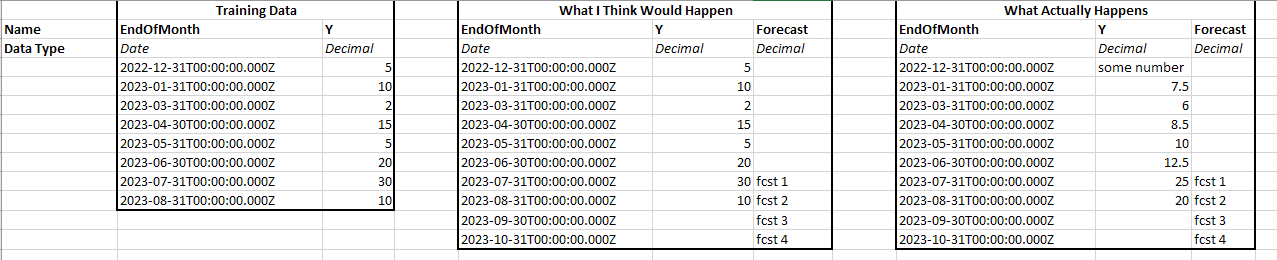
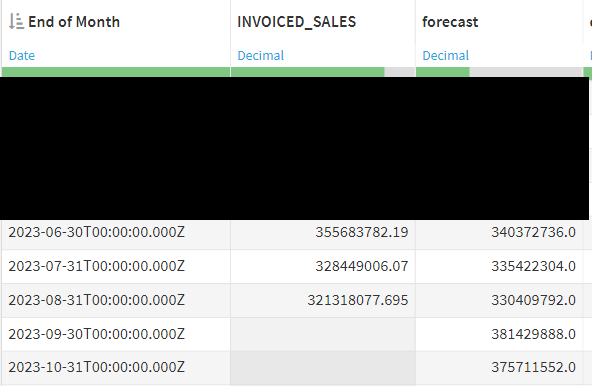
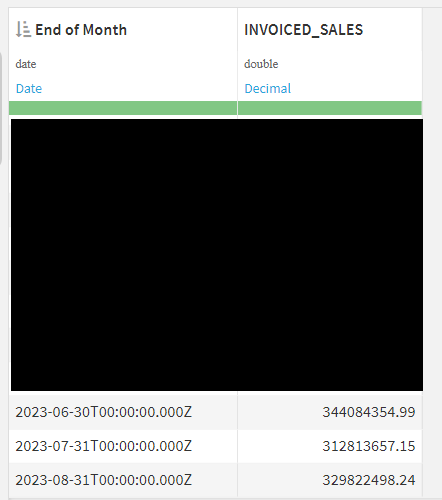
I'm using the visual time-series functionality for a monthly series. The dates are all set to the last day of the month, and the data contains no missing values. After training a model using the default settings and viewing the predicted data, there is numerical interpolation happening that I would not expect since there are no missing values. I've attached a picture of some mock data to try to help explain. For example, my 8/31/23 Y value in the predicted data has a value of 20, which is the average of the 7/31 and 8/31 values in the training data. Changing the numeric interpolation method to 'previous' fixes this, but what is going on under the hood that there is interpolation happening at all when there are not missing values? I found this post which might be related, but wasn't able to make total sense of it.
Operating system used: Windows
Hi,
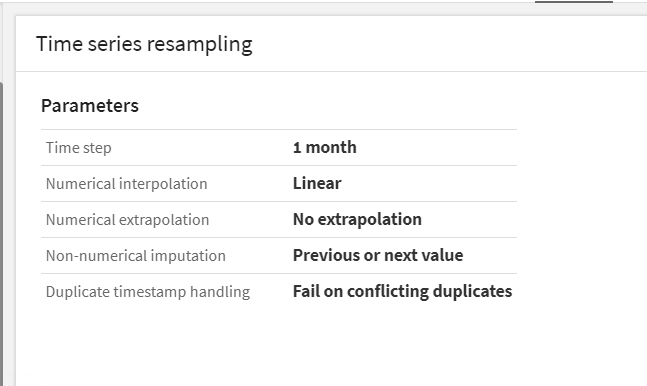
I cannot reproduce that on my side, could you tell us what settings you used for the training session ? More specifically the General settings and the Time series resampling parameters.
Thanks
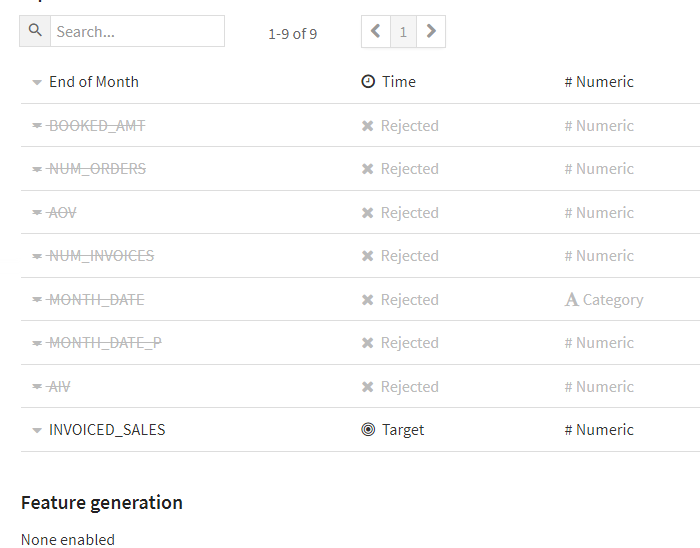
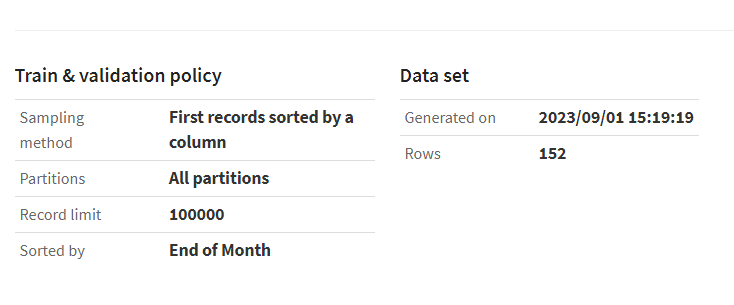
Here are my settings. Initially when the client reached out to me with the problem I tried to recreate in my own environment and was unable to do so, but I haven't been able to uncover anything they're doing incorrectly. I assumed the issue would correct itself when they upgraded form dss 11 to dss 12, but their issue persisted.
