Sign up to take part
Registered users can ask their own questions, contribute to discussions, and be part of the Community!
Registered users can ask their own questions, contribute to discussions, and be part of the Community!
Hello,
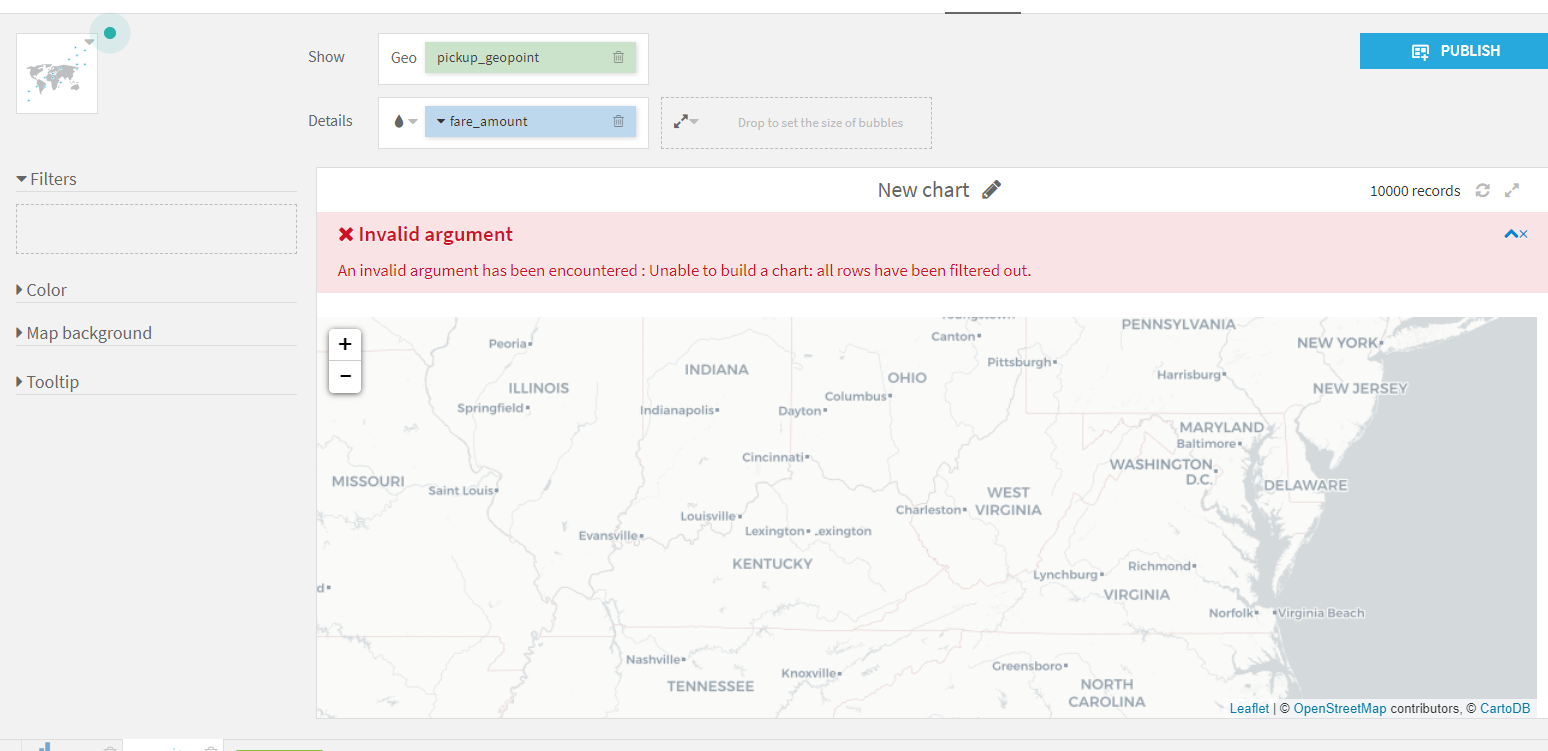
I can't draw the Geopoint curve. It put me the error of "Invalid argument". Do i need to change the format of geopoint that is "POINT(x y)" ?
Hello MS,
Geopoints can only be used for maps in charts.
What type of visualizations are you trying to do with geopoint curve?
Hello MS,
Geopoints can only be used for maps in charts.
What type of visualizations are you trying to do with geopoint curve?
