Sign up to take part
Registered users can ask their own questions, contribute to discussions, and be part of the Community!
Registered users can ask their own questions, contribute to discussions, and be part of the Community!
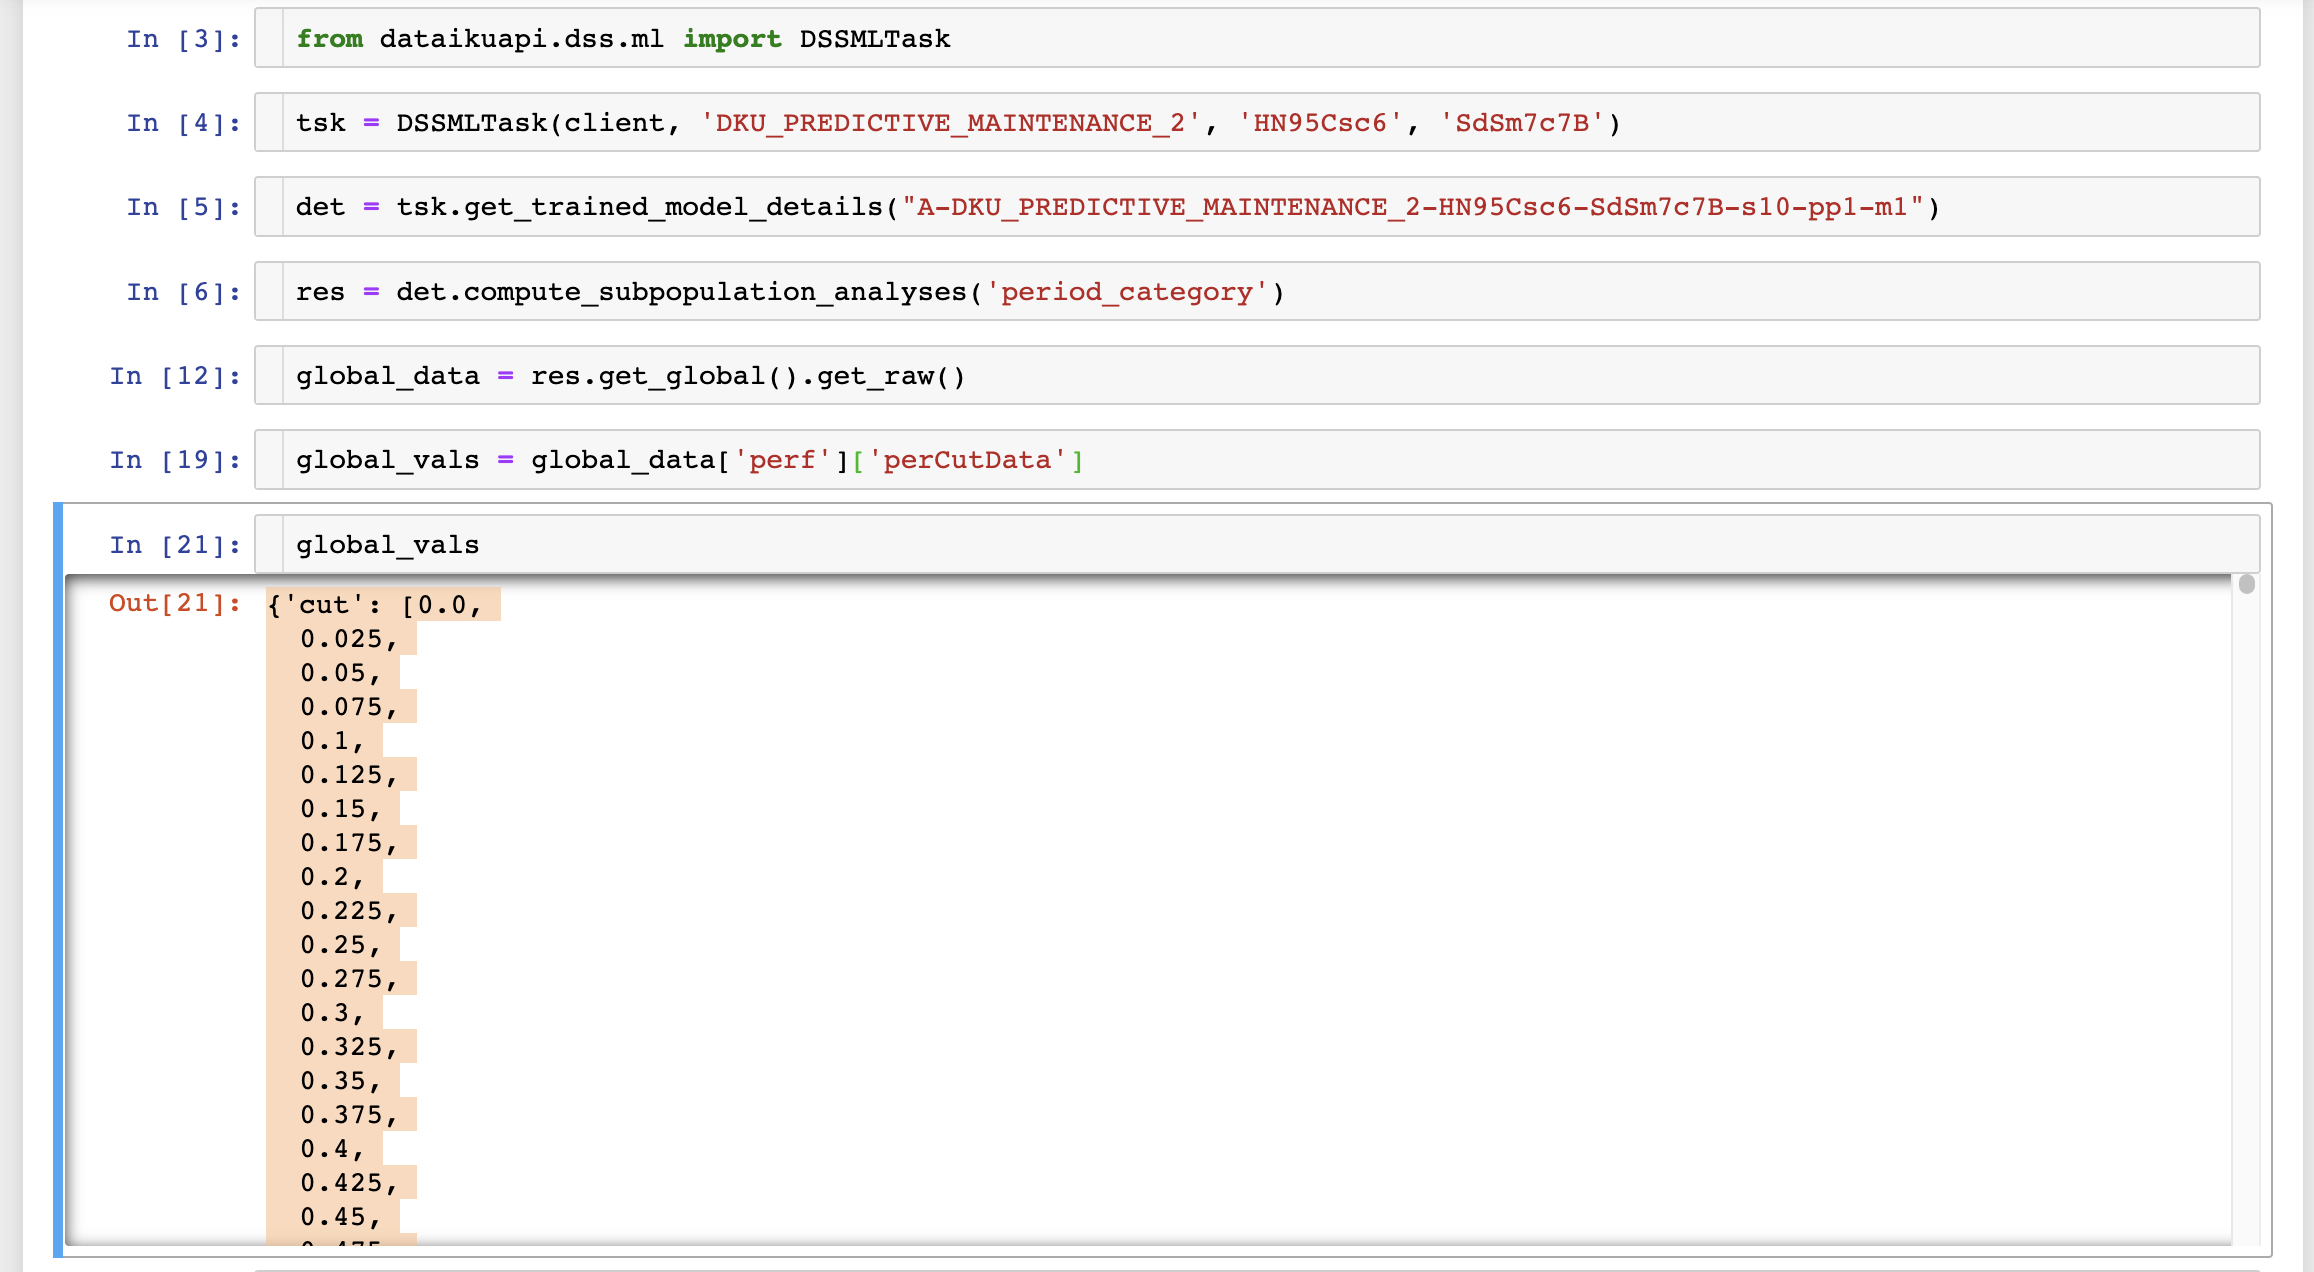
I am trying to fetch the metrics from the Subpopulation Analysis tab. I have created a Python notebook for this:
from dataikuapi.dss.ml import DSSMLTask

tsk = DSSMLTask(client, 'DKU_PREDICTIVE_MAINTENANCE_2', 'HN95Csc6', 'SdSm7c7B')
det = tsk.get_trained_model_details("A-DKU_PREDICTIVE_MAINTENANCE_2-HN95Csc6-SdSm7c7B-s10-pp1-m1")
res = det.compute_subpopulation_analyses('period_category')
global_data = res.get_global().get_raw()
global_vals = global_data['perf']['perCutData']
Every metric has 40 values just like the number of the perCutData. I do not understand what is the logic behind this attribute and its number. If you select the features (perf and preCutData), and metric name, alongside the number of the modality, you will get 40 scores for the metric. I have noticed that the 6th number out of 40 for every metric is correct. To be honest, I do not know why. Does anyone know about this?
{'nbRecords': 271,
 'weightedNbRecords': 271.0,
 'randomState': 1337,
 'onSample': False,
 'perf': {'perCutData': {'cut': [0.0,
    0.025,
    0.05,
    0.075,
    0.1,
    0.125,
    0.15,
    0.175,
    0.2,
    0.225,
    0.25,
    0.275,
    0.3,
    0.325,
    0.35,
    0.375,
    0.4,
    0.425,
    0.45,
    0.475,
    0.5,
    0.525,
    0.55,
    0.575,
    0.6,
    0.625,
    0.65,
    0.675,
    0.7,
    0.725,
    0.75,
    0.775,
    0.8,
    0.825,
    0.85,
    0.875,
    0.9,
    0.925,
    0.95,
    0.975],
   'tp': [62.0,
    61.0,
    61.0,
    58.0,
    57.0,
    56.0,
    56.0,
    50.0,
    48.0,
    45.0,
    42.0,
    37.0,
    33.0,
    31.0,
    31.0,
    29.0,
    27.0,
    25.0,
    24.0,
    23.0,
    19.0,
    15.0,
    13.0,
    11.0,
    9.0,
    9.0,
    8.0,
    5.0,
    5.0,
    4.0,
    2.0,
    2.0,
    1.0,
    1.0,
    0.0,
    0.0,
    0.0,
    0.0,
    0.0,
    0.0],
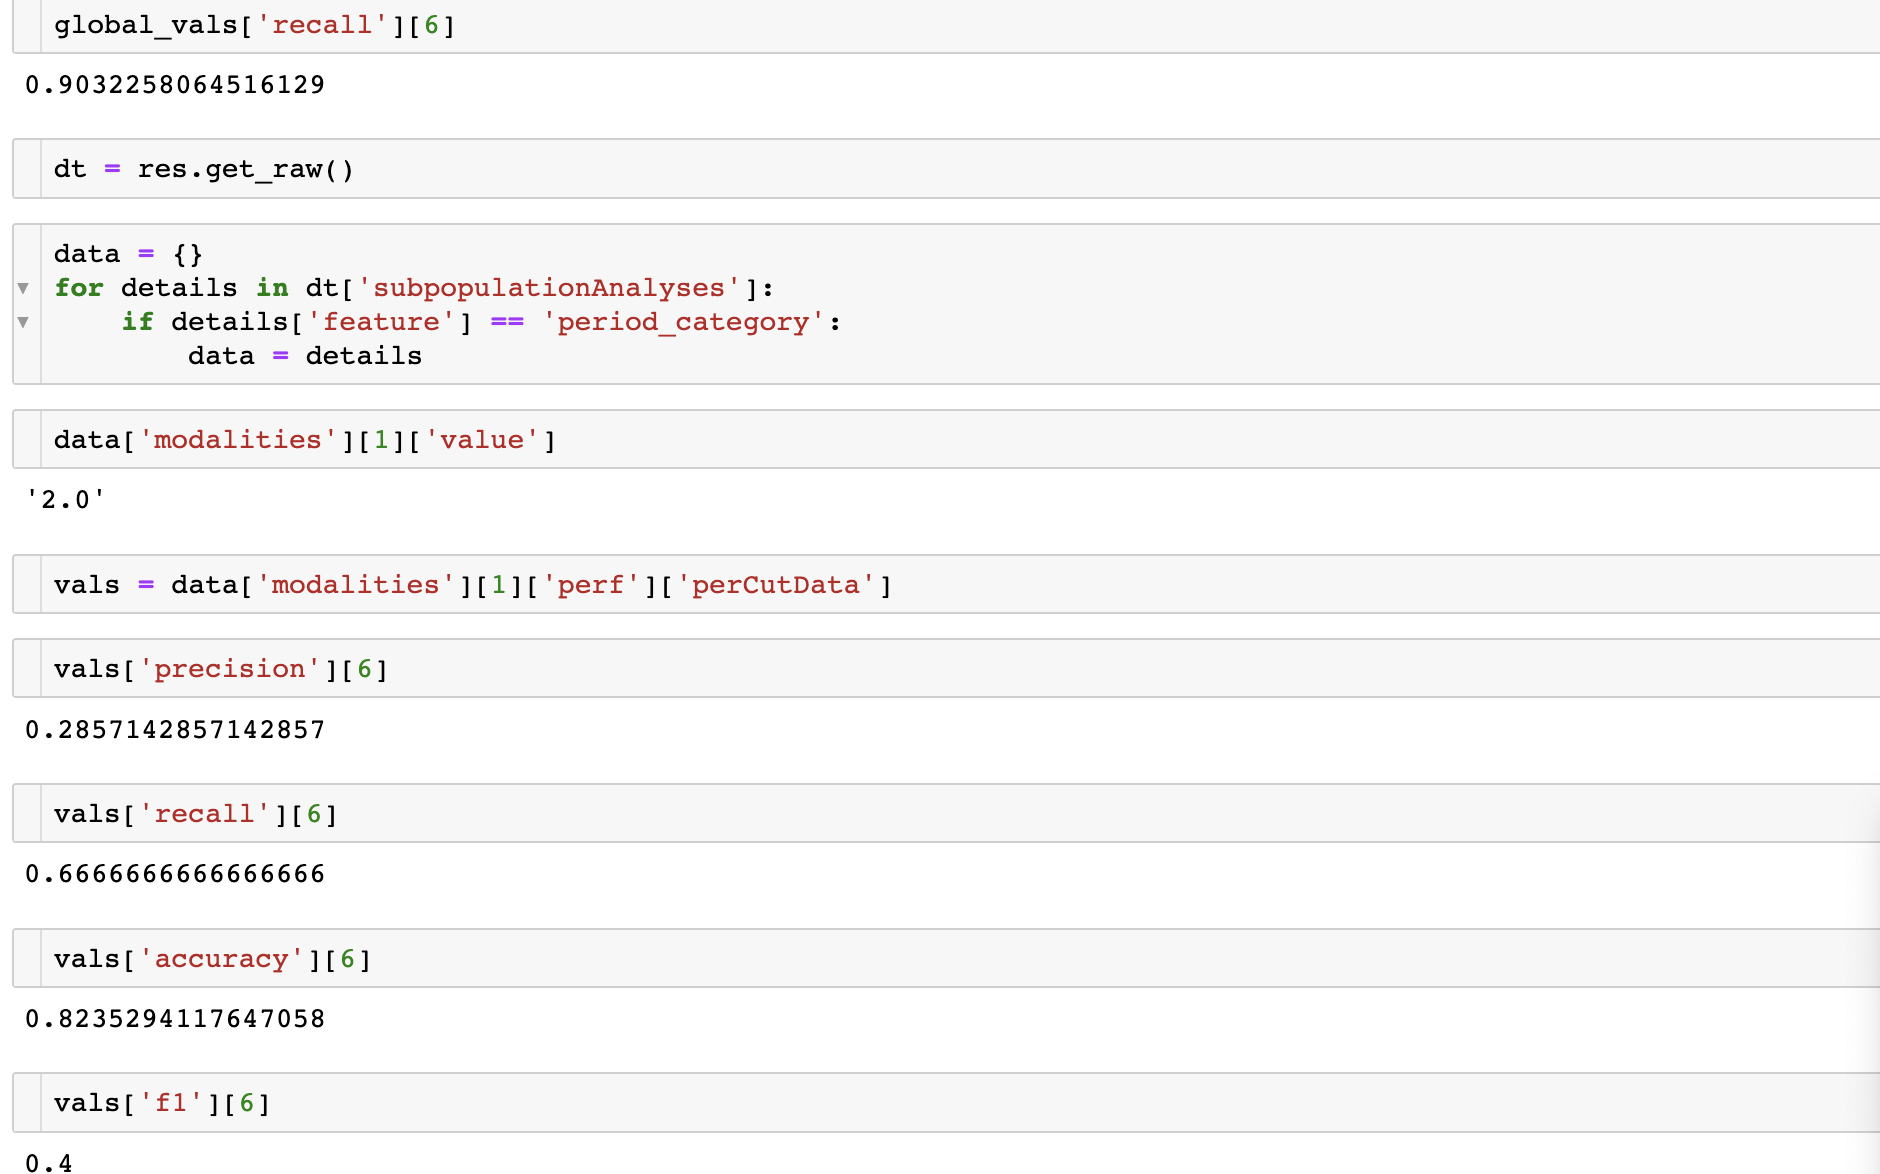
Here is the code used for fetching the scores of the metrics.
dt = res.get_raw()

data = {}
for details in dt['subpopulationAnalyses']:
    if details['feature'] == 'period_category':
        data = details
data['modalities'][1]['value']
vals = data['modalities'][1]['perf']['perCutData']
vals['precision'][6]
vals['recall'][6]
vals['accuracy'][6]
Operating system used: Mac OS
Ok!
Regarding:
To be honest, I do not know why the sixth number gave me the right results. I was checking the positions and this was the one that gave the the correct results for al the metrics.
I also don't see why the 6th values (e.g. values for threshold=0.15) would be the model's current metrics if your active threshold is not 0.15. Are you sure that nobody changed the threshold of the model?
Regarding:
To sum up, I am asking how to interpret these values.
I will try to give you some context.
Binary classification models have a threshold that can be adjusted to find the right balance between false positives and false negatives (c.f. threshold optimization doc).
In the UI, you can see and modify the active threshold from the model report (e.g. in the top-right corner of the"Confusion Matrix" tab).
Since modifying this threshold will change the number of false positives and false negatives, modifying the threshold will impact some metrics such as: accuracy, precision, recall, f1 score, hamming loss, etc.
Therefore, when we compute the threshold-dependent metrics, we compute them for each possible threshold.
So:
And we store all the resulting values in "perCutData".
The different keys of the "perCutData" dict are:
So, if you want to know what the precision of your model would be with threshold=0.075, you can check:
# this will be the "precision" for threshold = 0.075:
global_data["perf"]["perCutData"]["precision"][3]

# you can check that the threshold for [3] is 0.075
assert global_data["perf"]["perCutData"]["cut"][3] == 0.075
Does it help?
Are there still some values that you can't interpret? Are there specific things that you would like me to explain?
Hi @liotie ,
Some of the metrics depend on the threshold above whether you consider a prediction to be of positive class or not, this threshold is set on the “confusion matrix” tab.
The reason you see an array of values is that we compute all of the values at once all the values for all the thresholds to get the table as displayed in the UI. To display only your chosen metrics, you would fetch the index of the chosen threshold, which in your case appears to be 6th.
Thanks,
Hello AlexT,
Thank you for your response!
Ι have checked my threshold and it is 0.40. Based on the array of values, the correct value should be placed on place 14th, not 6th.
I would like to fetch these metrics for a critical project and verify they are correct. Is there any documentation describing all the generated values for the thresholds?
Regards,
Eva
Hello, I'm trying to dive into your screenshots to understand the issue you're facing.
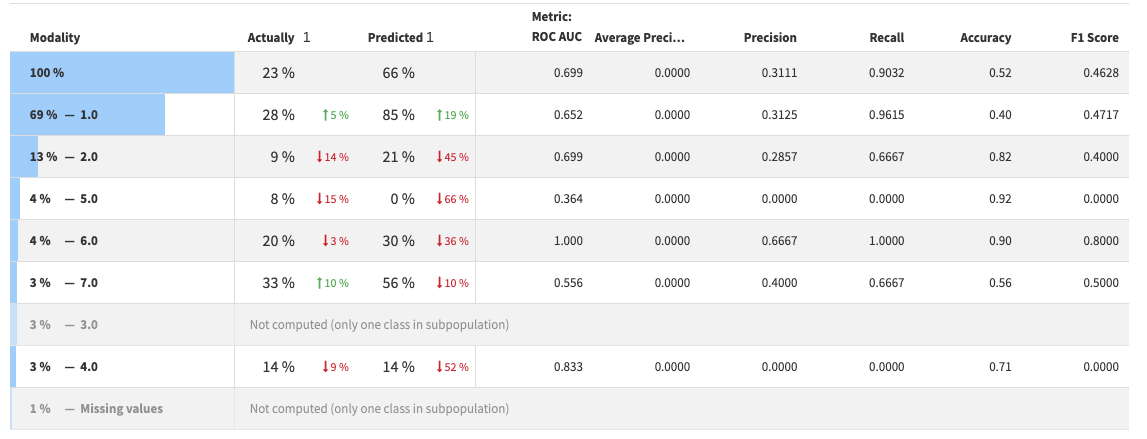
According to your screenshot "subpopulation_tab_metrics.png", the recall for your model's threshold is 0.6774. Right?
And when your print...
global_vals["recall"][6]
...you get 0.9032258.
This proves that the 6th value is not the correct one right?
The same remark applies to non-global metrics. For instance, when you print:
data["modalities"][1]["perf"]["perCutData"]["precision"][6]
...you don't get the same value than the one that appears on your subpop table screenshot.
Moreover, if your threshold is 0.4, the corresponding values are the 17th, not the 14th.
For instance, if you were to print the 17th value for the global recall, you should get 0.6774. Could you confirm?
To summarize, I'm not sure I understand what makes you think that the 6th values are correct while the 17th aren't.
Would you be willing to rephrase?
Hello,
The screenshot that was previously attached regarding notebook metrics has been updated. It was wrong.
Let's explain the notebook's cells:
global_vals["recall"][6]
This line refers to the model's overall recall, which stands at 0.903, mirroring the value displayed in the subpopulation analysis tab.
data["modalities"][1]["perf"]["perCutData"]["precision"][6]
This line refers to the precision of the model of the modality "2". As observed in the tab, the precision for this modality is 0.285.
To answer your question, I have retrieved the 17th position of the global variables and I get this
0.4032258064516129
Ok!
Regarding:
To be honest, I do not know why the sixth number gave me the right results. I was checking the positions and this was the one that gave the the correct results for al the metrics.
I also don't see why the 6th values (e.g. values for threshold=0.15) would be the model's current metrics if your active threshold is not 0.15. Are you sure that nobody changed the threshold of the model?
Regarding:
To sum up, I am asking how to interpret these values.
I will try to give you some context.
Binary classification models have a threshold that can be adjusted to find the right balance between false positives and false negatives (c.f. threshold optimization doc).
In the UI, you can see and modify the active threshold from the model report (e.g. in the top-right corner of the"Confusion Matrix" tab).
Since modifying this threshold will change the number of false positives and false negatives, modifying the threshold will impact some metrics such as: accuracy, precision, recall, f1 score, hamming loss, etc.
Therefore, when we compute the threshold-dependent metrics, we compute them for each possible threshold.
So:
And we store all the resulting values in "perCutData".
The different keys of the "perCutData" dict are:
So, if you want to know what the precision of your model would be with threshold=0.075, you can check:
# this will be the "precision" for threshold = 0.075:
global_data["perf"]["perCutData"]["precision"][3]

# you can check that the threshold for [3] is 0.075
assert global_data["perf"]["perCutData"]["cut"][3] == 0.075
Does it help?
Are there still some values that you can't interpret? Are there specific things that you would like me to explain?
Thank you so much Gaspard! Your response solved my issue!
