Sign up to take part
Registered users can ask their own questions, contribute to discussions, and be part of the Community!
Registered users can ask their own questions, contribute to discussions, and be part of the Community!
Hello Community,
is it possible to draw Polylines in Dataiku/Charts/Maps like in Google Maps?
Is there a plugin or the possibility to achieve that via code?
Many thanks!

Hi,
This is possible in DSS with native data and charting capabilities:
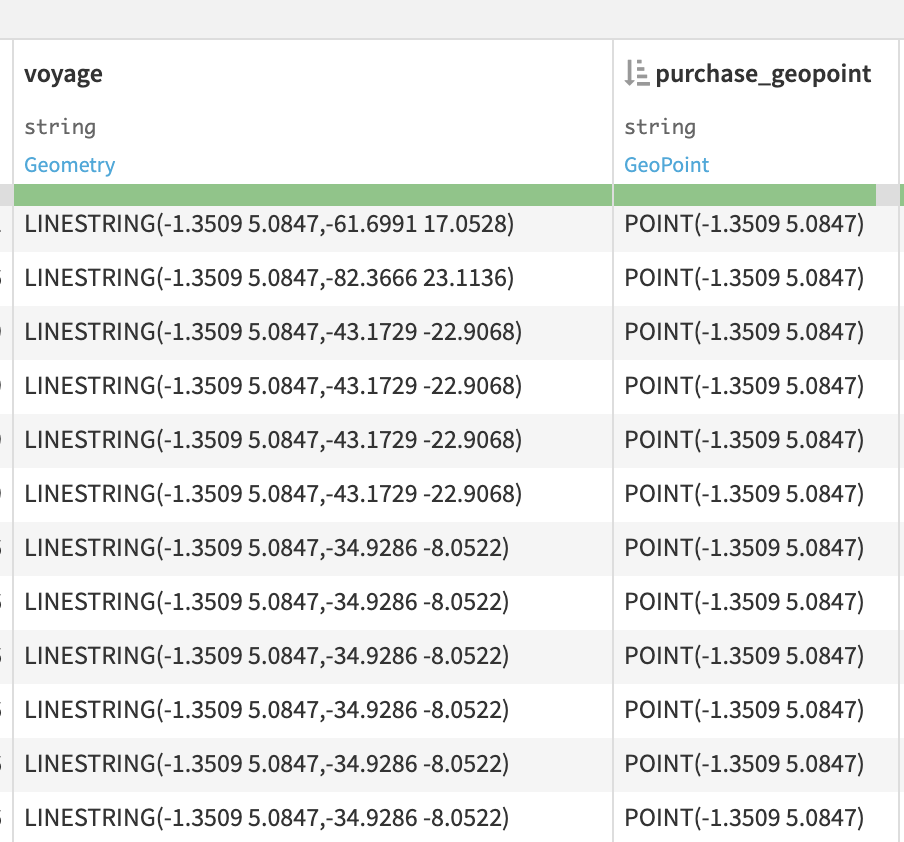
1. Concatenate your data as a string into a LineString or Polygon, etc. as described on this page https://en.wikipedia.org/wiki/Well-known_text_representation_of_geometry
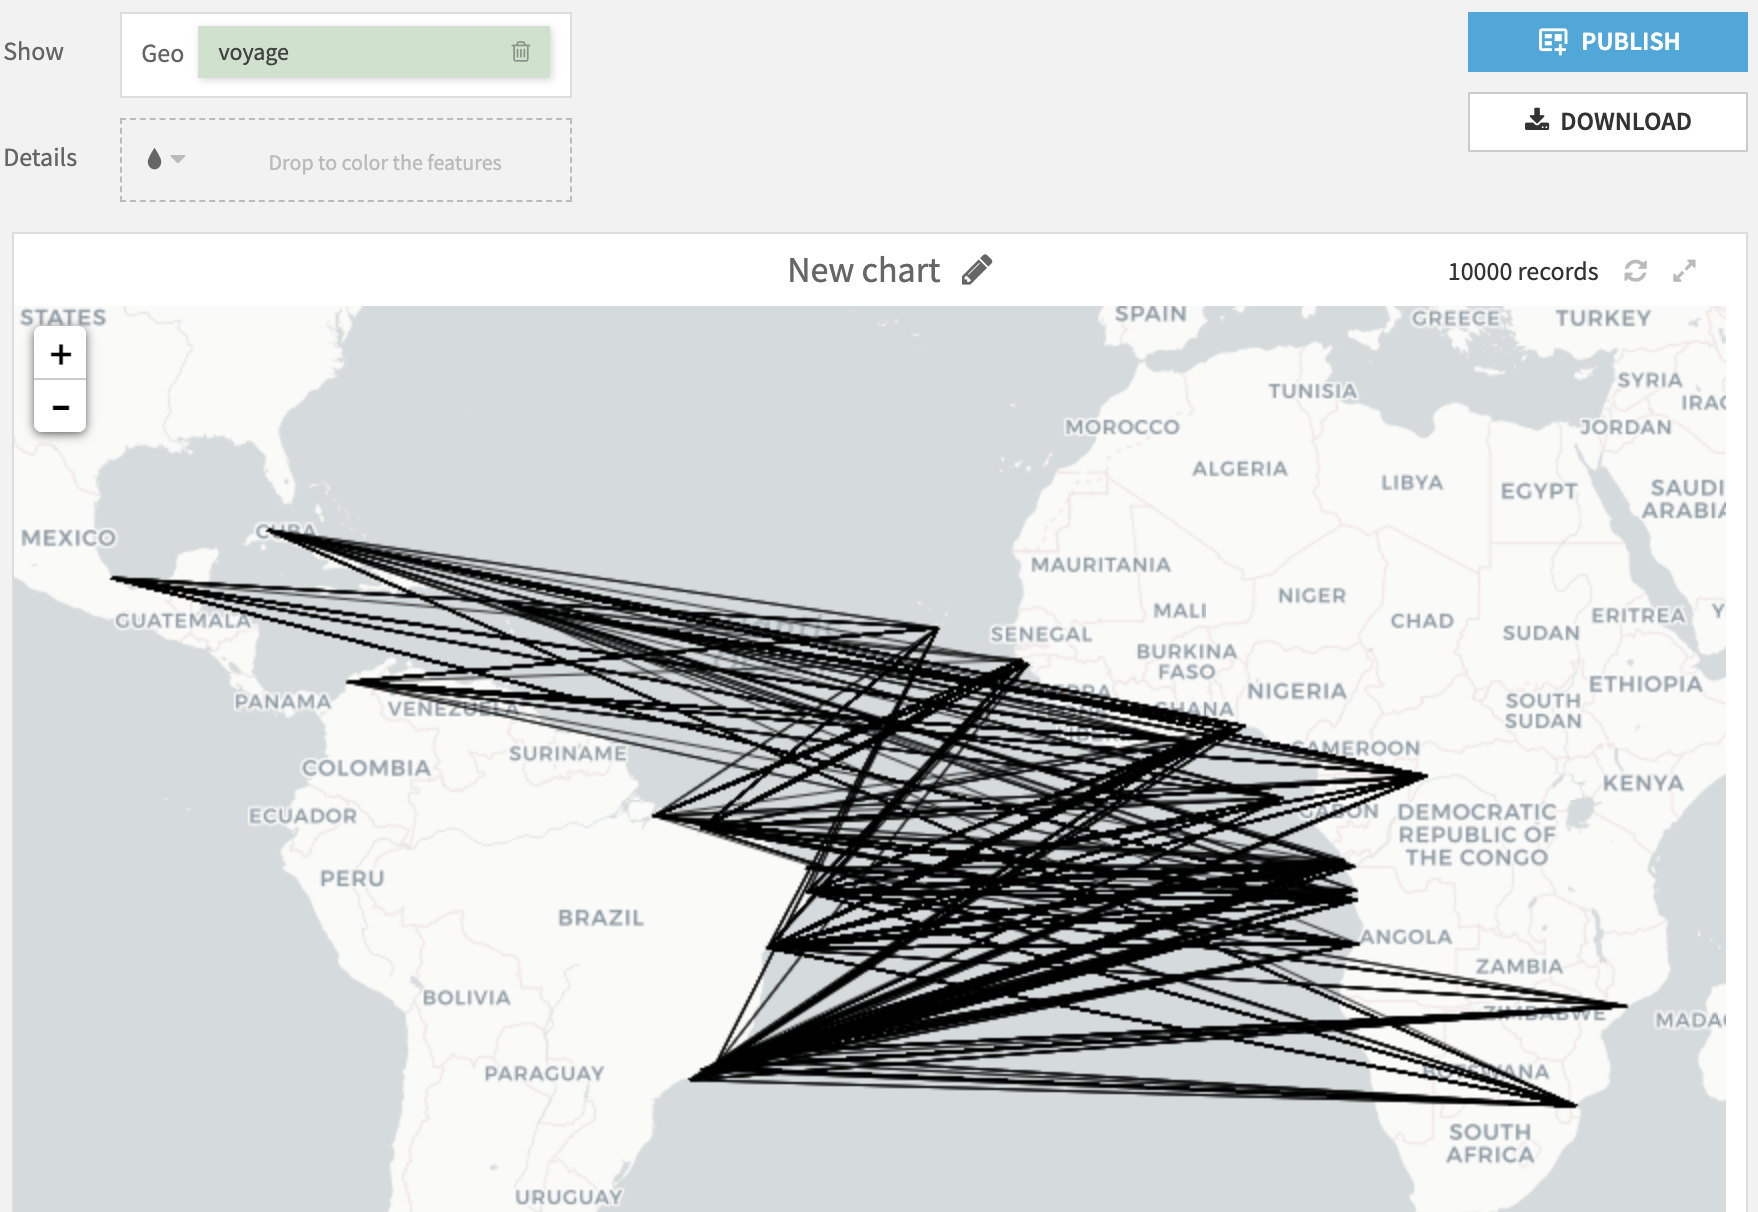
2. In the charts, use the Geometry Map and the column that you created.
See my examples below (with LineStrings).
I hope this helps.
Hey Community,
Some ideas around here? 😊
Thanks!
@m_sch ,
I'm not aware of a way to do what you are showing with native functions in DSS's charting tools. I'm sure that you could do this type of thing using DSS Data using an R or Python recipe. You may also be able to connect a GIS tool like QGIS to Dataiku data.
Related, I'd like to invite our NYC virtual user group meeting this month about Geo Analytics with Dataiku. We will meet virtually via zoom this Thursday, Jun 24 from 11:00 AM - 12:00 PM (EDT). We will have one of Dataiku's Product Managers Clémence Bic presenting and I expect that we will have a bit of time for Q&A.
cc: @ClemenceB
Hi @tgb417
thanks for your input on this!
I'm sure that you could do this type of thing using DSS Data using an R or Python recipe.
Could you explain that a little be more? Is it possible to draw/render a chart based on a R or Python recipe? But to draw a polyline we may need another map provider?
Related, I'd like to invite our NYC virtual user group meeting.
That looks very interesting.
Many thanks!
Hi,
This is possible in DSS with native data and charting capabilities:
1. Concatenate your data as a string into a LineString or Polygon, etc. as described on this page https://en.wikipedia.org/wiki/Well-known_text_representation_of_geometry
2. In the charts, use the Geometry Map and the column that you created.
See my examples below (with LineStrings).
I hope this helps.
Hey @Manuel,
many thanks for the explanation, that worked really great!
King regards
(Accepted as solution)

