Sign up to take part
Registered users can ask their own questions, contribute to discussions, and be part of the Community!
Registered users can ask their own questions, contribute to discussions, and be part of the Community!
Welcome to Conundrum 16! Today we ask ourselves - “What makes Data beautiful?” as well as trying to create a little beauty of our own.
Attached is a dataset surrounding posts on the Subreddit r/dataisbeautiful - which is well worth your time if you aren’t already a fan! We have a few columns including the posts id, it’s Karma score, and the time it was created.
The challenge is this: determine how the time a post is created affects it’s Karma score - and represent your findings as beautifully as possible! Beauty could mean elaborate, but there is also beauty in data presented simply. Happy visualising!
Feel free to share your results - or tips for creating beautiful data representations - in the comments below!
For those not familiar with Reddit Karma represents the total of the number of people who have 'upvoted' (think Kudos) a post less the number who have 'downvoted' it.
The visualization conundrums always present a fun challenge! There might be quite a number of ways to show a visualization. Not being a scatterplot expert by any means, the results I am seeing initially might indicate that the earlier the post, the greater the karma.
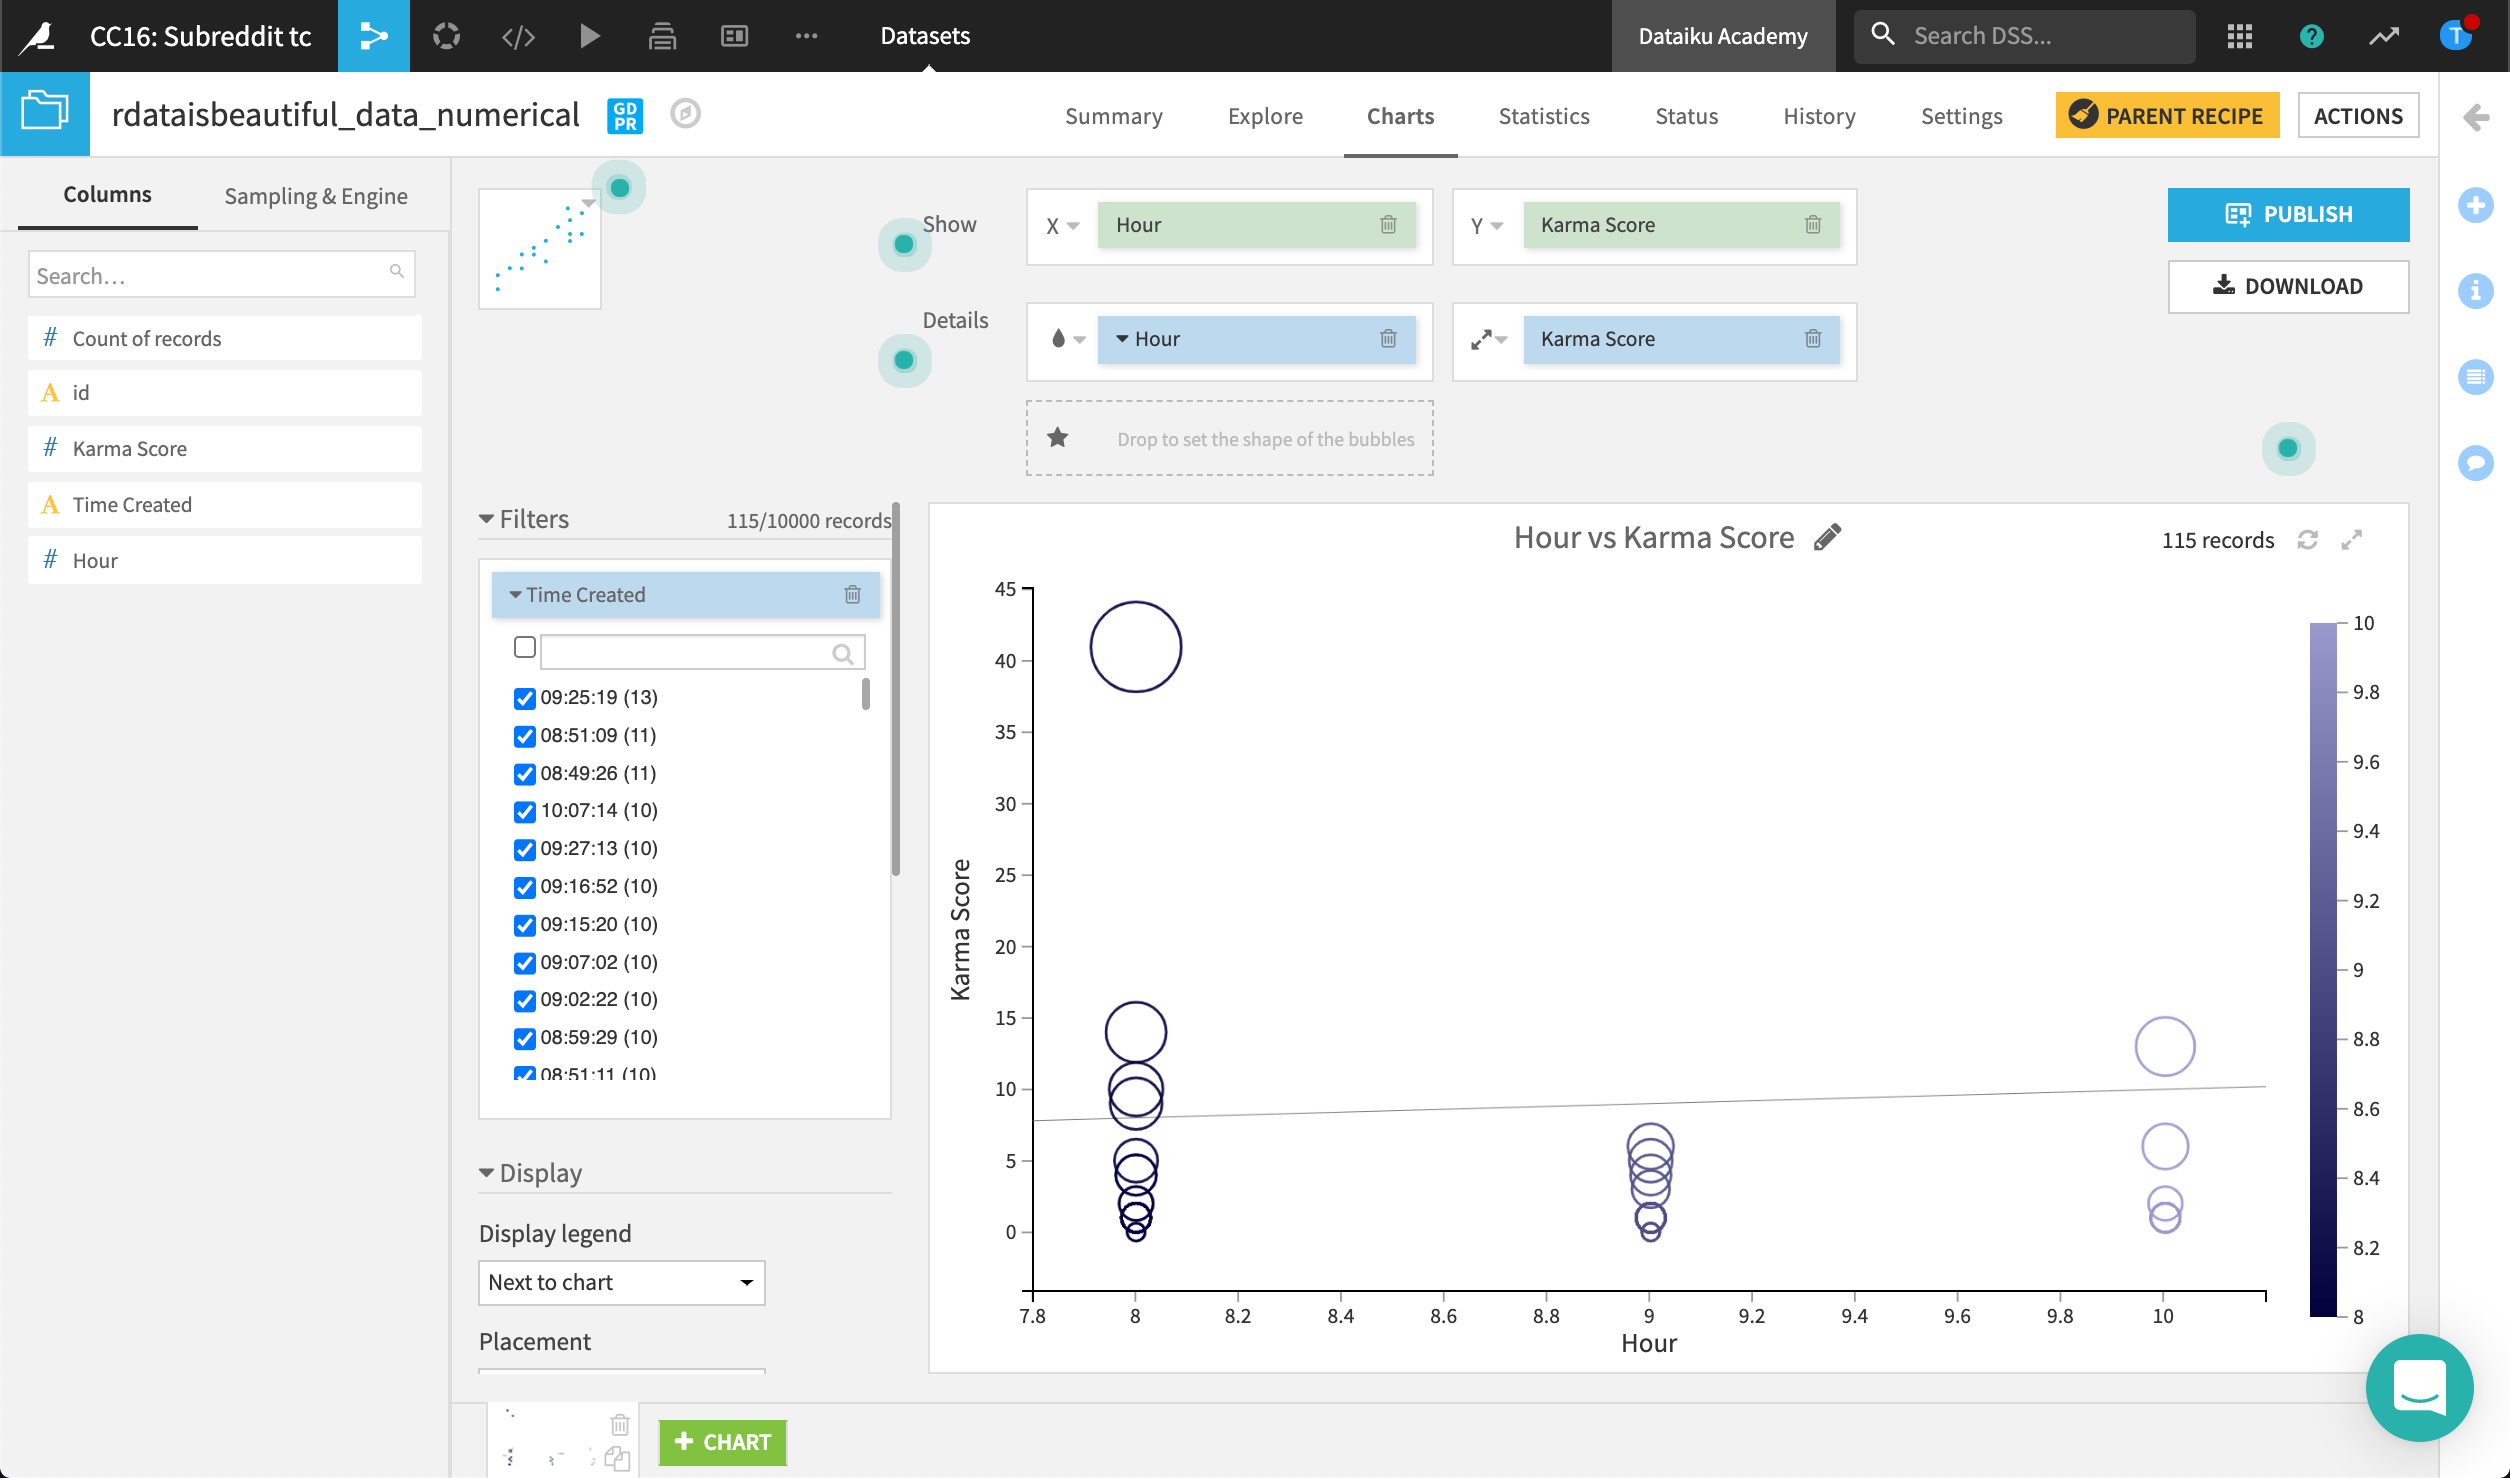
My goal in creating this was to show the correlation between karma score and the hour that the post was created. To do this, I parsed the date column (assuming it's hour:min:sec), then extracted the date components, keeping only the hour, and making sure my hour column is an integer.
I first tried to create a correlation matrix - still trying to figure out what I'm looking at.
Then I tried creating a chart - - and in the scatterplot, I filtered out most of the data, keeping only those with the greatest frequency of time created, just to keep it minimal. I'm sure my results would be different if I had not filtered this way.
When looking at the highest karma scores on individual posts (Karma >= 15k, n = 683), I discovered the following pattern. The range of the Karma Scores is given by the color binning shown on the right side.
It is interesting to me that the 4:00am to 5:00am hour is producing the most supper karma posts. Here in the eastern USA 4:00am-5:00am is usually the quiet hour. The quiet hour is the hour of the day when the least traffic typically comes to a web site. And that the after-work period (7:00pm - 11:00pm) is not producing very many Super Karma Posts. That makes me wonder if these Super Karma Posts are being done by professional posters. That is folks who are making a lot of posts and also using automated tools to "schedule" their posts. For each individual post, I wonder what these folks' posting habits are? Are they consistently posting at these hours?
I sort of wish I had a data dictionary that would tell me in what time zone the times are taken and if participants are being recorded in their own time zone or the zone of a server.
Maybe an opportunity to do some more digging.
What do others think? What are you trying?
Turns out that the id appears to be the message id. Not the author id.


